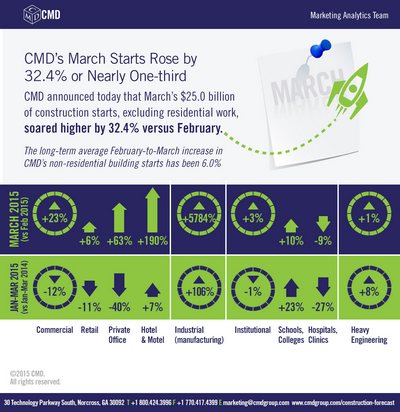
CMD announced that March’s $25 billion of construction starts, excluding residential work, soared higher by 32.4 percent (or nearly one-third) versus February. It was a much greater increase than would have been expected based solely on seasonality. The long-term average February-to-March increase in CMD’s nonresidential building starts has been 6 percent.
While the large month-to-month gain this year warrants cheers, it should be noted that February-to-March’s rise last year was also outsized. In fact, it was even bigger, at +40.3 percent.
Furthermore, compared with the same standalone month of 2014, March of 2015 was -5.1 percent.
Year-to-date starts in 2015 are an improvement, however, at +2.6 percent versus Q1 of 2014.
(The starts figures throughout the remainder of this report are not seasonally adjusted, also termed NSA.)
The starts figures are in “current” dollars, meaning they are not adjusted for inflation.
“Non-residential building” plus “engineering/civil” work accounts for a considerably larger share of total construction than residential activity. The former’s combined proportion of total construction put in place in the Census Bureau’s February report was 65 percent versus the latter’s 35 percent.
CMD’s construction starts are leading indicators for the Census Bureau’s capital investment or put-in-place series. Also, the reporting period for starts (i.e., March 2015) is one month ahead of the reporting period for the investment series (i.e., February 2015.)
According to the Bureau of Labor Statistics, employment in construction stayed flat in March after significant gains totaling 144,000 net new jobs in the preceding four months. Year-over-year employment in construction is now 282,000, for a percentage increase of 4.7 percent. By way of comparison, the year-over-year percentage increase in U.S. total jobs is 2.3 percent.
Before there can be onsite construction activity, projects must be contemplated and planned by owners and rendered into working drawings by design professionals. The year-over-year increase in architectural and engineering services jobs in March was 3.8 percent, the same as in February. That February-March tie at 3.8 percent was the highest in eight years, dating back to March 2007 (4 percent).
Among the major subcategories of construction starts, commercial work (23.1 percent) recorded the largest percentage gain month to month in February. Institutional starts (2.6 percent) also advanced, as did engineering/civil work (1.3 percent), but their increases were barely more than tentative.
Industrial starts (5784.3 percent) streaked into the stratosphere. This was partly due to the mathematics of the percentage change calculation. The denominator from the base period (i.e., February) was a very low number.
It’s also true that industrial starts are prone to volatility depending on the timing of go-aheads for specific ultra-large projects. March’s “Top 10” list includes $4 billion of groundbreaking work on an ethane cracker and derivatives facility in Louisiana for Sasol Limited of South Africa. While lower world oil prices are causing some major U.S. investment projects to be put on hold, the improvement in America’s domestic energy supplies is sparking opportunities as well.
When March of 2015 is compared with the same month of last year, all three major sub-categories struggled to varying degrees. Commercial (-35.4 percent) was down the most, followed by institutional (-12.5 percent), then heavy engineering (-2.1 percent).
The value of industrial starts, though, was ahead by 196 percent.
The 2.6 percent gain in year-to-date total starts in March resulted from better volumes in engineering (7.7 percent) and the smaller category of industrial (105.5 percent). Institutional work (-1.1 percent) fell behind slightly; but it’s been the commercial category (-11.5 percent) that has disappointed the most.
Within engineering/civil work, the leading subcategory by dollar volume is “roads/highways”. In March, it recorded a 3.6 percent increase month over month (m/m), but that paled beside its 26.6 percent jump year-over-year (y/y) and its 16.8 percent increase year to date. Second most significant is the “water/sewage” subcategory, which was 10.5 percent m/m, -7.5 percent y/y and 3.2 percent ytd.
Within institutional, the dollar volume of “school/college” starts is about four times as great as for second-place “hospitals/clinics”. Educational facility starts have picked up across the board: 9.6 percent m/m; 17.7 percent y/y and 23 percent ytd. Healthcare starts are still in the doldrums: -9.3 percent m/m; -49 percent y/y and -27.1 percent ytd.
Commercial starts in March received strong boosts from “hotel/motel” (190 percent m/m; 8.7 percent y/y and 7.4 percent ytd), private office building (63.1 percent m/m; 27.5 percent y/y and -40.4 percent ytd) and government office building (43 percent m/m; -56 percent y/y; and -44.4 percent ytd) work. The significant “retail” (6.3 percent m/m; -13.8 percent y/y and -10.5 percent ytd) and “warehouse” (3.9 percent m/m; -26.6 percent y/y and 1.2 percent ytd) subcategories have also displayed recent perkiness.
Among the 12-month moving-average trend, two subcategories — “schools/colleges” and “roads/highways” — are clearly trending higher. “Private office buildings”, which had been headed downward over the past year, leveled off in March. All of the other categories have been moving within ranges minimally better or worse than flat.
Due to the signs of cyclical improvement in the construction sector, many analysts are becoming interested in how wage rates are performing. According to March’s Employment Situation report from the BLS, construction’s average hourly earnings at 2.6 percent year over year were better than for all jobs, at 1.8 percent. But average weekly earnings were exactly the same, 1.8 percent.
The value of construction starts each month is summarized from CMD’s database of all active construction projects in the U.S. Missing project values are estimated with the help of RSMeans” building cost models.
Source: Alex Carrick, chief economist, CMD Group.
 Join our thriving community of 70,000+ superintendents and trade professionals on LinkedIn!
 Search our job board for your next opportunity, or post an opening within your company.
 Subscribe to our monthly
Construction Superintendent eNewsletter and stay current.
Subscribe to our monthly
Construction Superintendent eNewsletter and stay current.