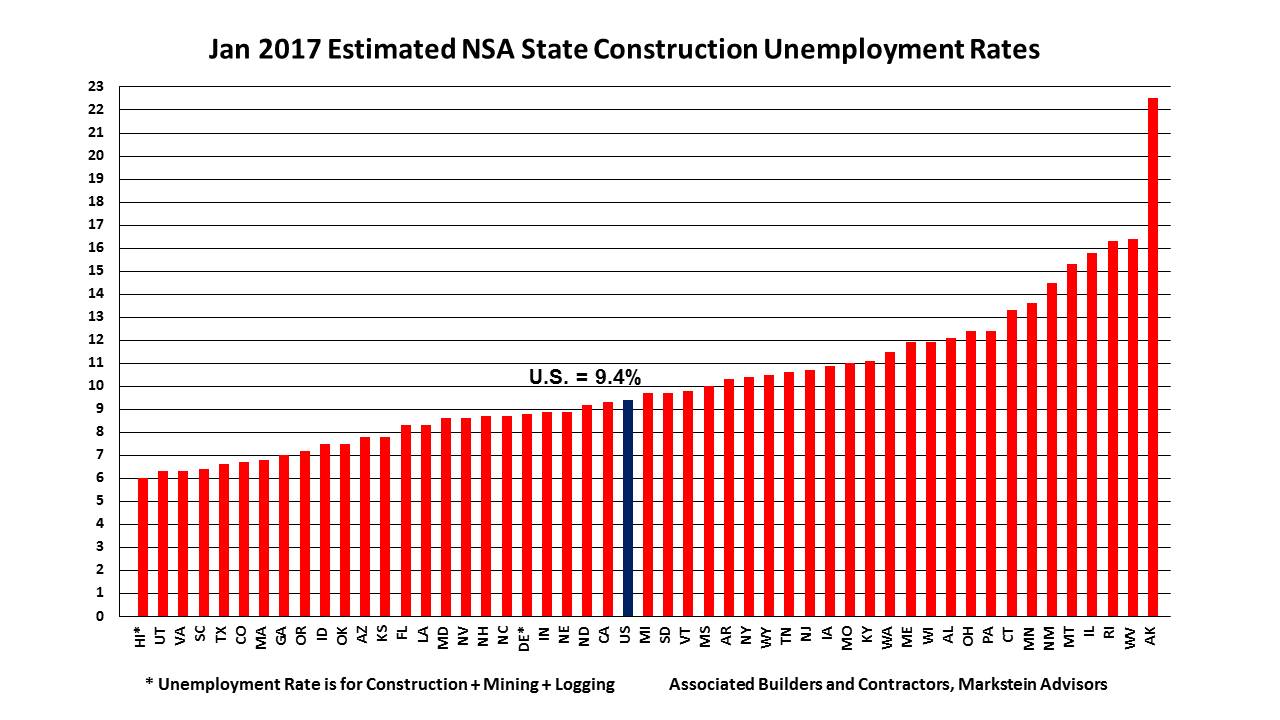
WASHINGTON, D.C.— Construction unemployment rates were down in 10 states and unchanged in three in January on a year-over-year basis, according to analysis released by Associated Builders and Contractors. For the nation and 37 states, rates were higher than in January 2016, ending 75 consecutive months of year-over-year declines. The national not seasonally adjusted construction unemployment rate of 9.4 percent was up 0.9 percent from January 2016, according to data from the U.S. Bureau of Labor Statistics.
Since these industry-specific rates are NSA, it is most accurate to evaluate the national and state-level unemployment rates on a year-over-year basis.
In spite of the year-over-year rise, this was the second lowest national January NSA construction unemployment rate since January 2007 when the rate was 8.9 percent. Meanwhile, BLS data showed that the industry employed 162,000 more workers than in January 2016.
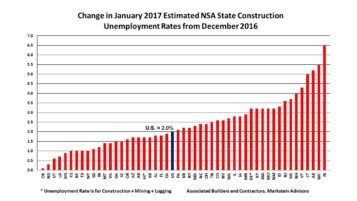
The usual pattern in the movement in the national NSA construction unemployment rate from December to January is an increase. Starting in 2000, when the BLS data for this series begins, the January rate has risen every year. This year’s 2 percent rate increase was no exception.
The Top Five States
The states with the lowest estimated NSA construction unemployment rates in order from lowest rate to highest were:
- Hawaii
- Utah and Virginia (tie)
- South Carolina
- Texas
Only one state, Hawaii, was also among the top five in December. Hawaii had the lowest rate among the states, with a 6 percent estimated construction unemployment rate unchanged from January 2016 and the state’s lowest January rate since the 5.1 percent rate in January 2006.
Utah and Virginia, with a 6.3 percent construction unemployment rate, tied for the second lowest rate in January. This was a big jump for Utah, which was also one of the 10 states that experienced a year-over-year drop in its rate, and marked the seventh year in a row that its January rate was down from the year before. For Virginia, the January 2017 rate was the state’s second lowest estimated January rate since the 6.2 percent rate in 2007, behind January 2016’s industry unemployment rate of 5.8 percent.
South Carolina, with the fourth construction unemployment rate lowest rate (6.4 percent), recorded its second lowest January rate, after last January’s 6.2 percent, going back to the beginning of the January estimates in 2000. Texas recorded the fifth lowest rate at 6.6 percent, despite having the seventh largest year-over-year increase in its rate among the states, up 1.5 percent.
The Bottom Five States
The states with the highest NSA construction unemployment rates in order from lowest to highest rates were:
- Montana
- Illinois
- Rhode Island
- West Virginia
- Alaska
Four of these states—Alaska, Illinois, Montana and West Virginia—were also among the five states with the highest construction unemployment rates in December. Alaska recorded the highest estimated NSA construction unemployment rate for the fourth month in a row at 22.5 percent. This is to be expected since these are NSA construction unemployment rates; however, the state also had the largest year-over-year increase in its rate at 4.7 percent.
West Virginia had the second highest construction unemployment rate in January (16.4 percent) and its 5.5 percent increase from December was the second largest among the states behind Rhode Island’s 6.5 percent increase.
Rhode Island had the third highest estimated NSA construction unemployment rate in January (16.3 percent); however, it was among the 10 states with a drop in its year-over-year rate (down 0.3 percent) and the state’s lowest estimated January rate since the 11.3 percent rate in January 2007.
Illinois had the fourth highest rate in January, 15.8 percent after recording the third highest rate in December, and Montana had the fifth highest construction unemployment rate in January (15.3 percent), but was among the 10 states with a drop in its year-over-year rate (down 0.3 percent).
Note on Data Revision
On March 13, the Bureau of Labor Statistics (BLS) released its benchmark revision of state employment data covering the period from April 2015 through December 2016 (some data prior to April 2015 were also revised). The models used to estimate state construction unemployment rates were updated incorporating the new data. The revised data and the updated models resulted in some changes to the previously estimated state unemployment rates. Read more on the impact of the revisions on previous construction industry unemployment rate estimates on ABC’s website.


 Join our thriving community of 70,000+ superintendents and trade professionals on LinkedIn!
 Search our job board for your next opportunity, or post an opening within your company.
 Subscribe to our monthly
Construction Superintendent eNewsletter and stay current.