| What is your title? | ||||
| Asst. Superintendent | 1.5% | |||
| Superintendent | 40.6% | |||
| Senior Superintendent | 27.4% | |||
| General Superintendent | 15.9% | |||
| Director/VP of Field Operations | 4.5% | |||
| Other | 9.3% | |||
| No Responses | <1% | |||
| What type of projects do you typically work on? | ||||
| Commercial | 71.0% | |||
| Residential | 10.8% | |||
| Industrial | 6.3% | |||
| Heavy/Highway | 3.6% | |||
| Other | 7.5% | |||
| No Responses | <1% | |||
| On average, how many hours a week do you work? | ||||
| Less than 40 hours | <1% | |||
| 40-49 hours | 28.6% | |||
| 50-59 hours | 43.9% | |||
| 60-69 hours | 22.2% | |||
| 70-79 hours | 3.0% | |||
| More than 80 hours | 1.2% | |||
| No Responses | <1% | |||
| On average, how stressed are you at your job? | ||||
| Extremely Stressed | Very Stressed | Stressed | A Little Stressed | Not Stressed |
| 4% | 16% | 37% | 37% | 5% |
| How happy are you at your current job? | ||||
| Unhappy | It’s Okay | Happy | Very Happy | Extremely Happy |
| 5% | 21% | 34% | 28% | 12% |
| What could your employer do to make you happier? (check all that apply) | ||||
| Better pay | 46.0% | |||
| Better training for job | 13.8% | |||
| More field resources | 42.3% | |||
| More office support | 34.3% | |||
| Better company incentives (car allowance, healthcare, etc). | 28.2% | |||
| Other | 20.2% | |||
| Do you feel there is a skilled labor shortage? | ||||
| Yes | 91.5% | |||
| No | 7.5% | |||
| No Responses | <1% | |||
| (For those who answered ‘Yes’ to, “Do you feel there is a skilled labor shortage?”) What do you think will help with the skilled labor shortage? | ||||
| Better training | 51.5% | |||
| More publicity on benefits of skilled labor jobs | 55.1% | |||
| Better mentoring | 46.1% | |||
| More resources from company | 17.3% | |||
| Outreach to schools | 56.8% | |||
| Better pay | 31.7% | |||
| Other | 12.3% | |||
| (For those who answered ‘No’ to, “Do you feel there is a skilled labor shortage?”) Why do you think your company is able to retain skilled labor? | ||||
| Good training | 28.5% | |||
| Mentoring program | 33.3% | |||
| Company compensates well | 42.8% | |||
| Outreach to schools | 4.7% | |||
| Other | 33.3% | |||
| Overall, what is your opinion of the younger, new-generation workforce? | ||||
| Bad | Okay | Good | Very Good | Excellent |
| 25% | 53% | 18% | 3% | 0% |
| Do you feel your company provides enough training and education for your role? | ||||
| Yes | 56.0% | |||
| No | 36.1% | |||
| No Responses | 7.8% | |||
| What types of technology do you use in the field for work-related items? (check all that apply) | ||||
| Laptop/Desktop Computer | 90.5% | |||
| Tablet | 64.3% | |||
| Smart Phone | 95.7% | |||
| BIM | 26.1% | |||
| Other | 6.8% | |||
| What type of social media do you use for your job (or related to your job)? | ||||
| 57.1% | ||||
| 4.2% | ||||
| 16.3% | ||||
| I do not use any social media | 39.8% | |||
| Other | 3.2% | |||
| What areas would you like more education/training on? (check all that apply) | ||||
| Scheduling | 45.7% | |||
| Mentoring others | 29.9% | |||
| Building means & methods | 29.6% | |||
| Jobsite safety strategies | 21.7% | |||
| Management of subcontractors | 34.8% | |||
| Working with owners | 19.0% | |||
| Spanish on jobsite | 39.8% | |||
| Time management | 34.2% | |||
| Moisture issues (concrete, mold, etc) | 13.4% | |||
| Other | 6.9% | |||
| What are you or others in your firm using for construction project scheduling now? (check all that apply) | ||||
| Oracle Primavera P6 | 30.1% | |||
| Suretrak | 10.4% | |||
| Asta Powerproject | 1.6% | |||
| Microsoft Project | 51.4% | |||
| Microsoft Excel | 29.8% | |||
| Not sure | 7.8% | |||
| Not applicable | 3.6% | |||
| Other | 9.5% | |||
| What percentage of your team’s projects finish on time? | ||||
| 0 – 20% | 2.7% | |||
| 21 – 40% | 3.0% | |||
| 41 – 60% | 10.8% | |||
| 61 – 80% | 16.2% | |||
| 81 – 100% | 59.0% | |||
| No Responses | 8.1% | |||
| If a project does get delayed, what are the most common causes that you see? (check all that apply) | ||||
| Subcontractors completed their part(s) late | 49.0% | |||
| Material delivery issues | 36.2% | |||
| Material thefts | <1% | |||
| Lower than anticipated productivity | 33.6% | |||
| Subcontractor availability | 33.6% | |||
| Weather | 40.1% | |||
| Client changes | 65.0% | |||
| When purchasing jobsite products (tools, safety equipment, etc.), how do you primarily go about buying? | ||||
| Phone | 22.2% | |||
| Website | 13.2% | |||
| Phone/Tablet app | 6.9% | |||
| Through field sales rep | 23.4% | |||
| Do not order in field, office handles | 19.2% | |||
| Other | 6.9% | |||
| No Responses | 7.8% | |||
| What type of news and articles would you like to see more of related to superintendents? (check all that apply) | ||||
| Products (new products, maintenance) | 52.6% | |||
| Projects | 46.4% | |||
| Superintendent interviews | 50.0% | |||
| Safety | 38.2% | |||
| Equipment | 32.6% | |||
| Economic data | 17.6% | |||
| Building means and methods | 66.9% | |||
| Labor issues | 44.1% | |||
| Other | 2.6% | |||
| Outside of construction what do you like to do? (check all that apply) | ||||
| Spend time with family | 82.3% | |||
| Active sports (running, biking, etc). | 35.6% | |||
| Watch sports | 29.0% | |||
| Fish | 36.2% | |||
| Ride motorcycle | 21.5% | |||
| Hunt | 26.7% | |||
| Other | 26.1% | |||
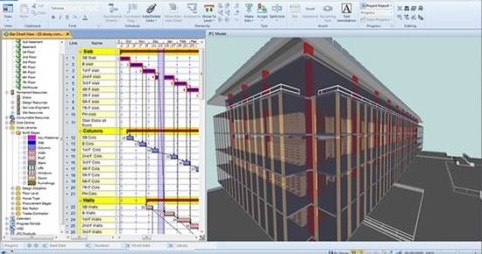
Asta Powerproject is one of the world’s leading schedule software solutions making it easier for teams to work collaboratively, using one real-time schedule.
Click here for more information and a free trial.
![]()
 Join our thriving community of 70,000+ superintendents and trade professionals on LinkedIn!
 Search our job board for your next opportunity, or post an opening within your company.
 Subscribe to our monthly
Construction Superintendent eNewsletter and stay current.
Subscribe to our monthly
Construction Superintendent eNewsletter and stay current.