
Survey reveals satisfaction on the job, stress levels and more
By Chris Maday Schmidt
Construction Superintendent recently partnered with AstaPowerproject to conduct a brief survey to superintendents via our LinkedIn group. The survey was compiled by a third-party source and included both closed and open-ended questions that covered a range of everyday topics on the jobsite—such as the skilled labor shortage and education and training, to on-time projects and scheduling. Of the responses we received, we learned more about your happiness levels, social media and tech usage, as well as your thoughts about the younger-generation workforce and more.
You spoke, we listened. Here is an overview of the results:
Happiness levels, stress factors
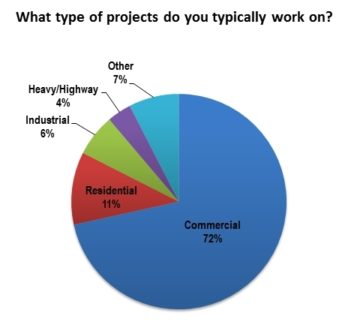
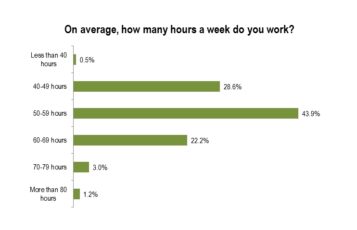
Ninety-one percent of survey participants identified as a superintendent—with 71 percent working in commercial trade and the majority on the job 50-59 hours per week. Respondents were asked, on a scale of 1-5 (with one being unhappy and 5 being extremely happy), how happy they were at their jobs. The overall result totaled 3.2 (with 3 being happy). When asked what their employer could do to make them happier, respondents checked all answers that applied. The top three responses were: 1) better pay, 2) more field resources and 3) more office support. Additional comments included [the need for] better subcontractors, opportunity for advancement and team-bonding events.
When asked how stressed they were, on average, 4 percent of superintendents answered that they were extremely stressed, 16 percent were very stressed; stressed and a little stressed tied at 37 percent and 5 percent responded that they were not stressed.
Skilled labor shortage
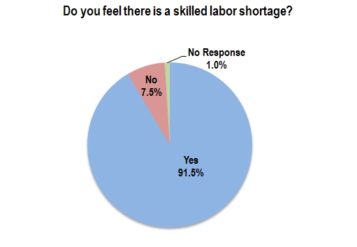
When superintendents were asked if they feel there is a skilled labor shortage, 91.5 percent answered in the affirmative. When asked what they think will help with the skilled labor shortage, answers ranged from outreach to schools, to more publicity on the benefits of skilled labor jobs to better training and mentoring. The majority of additional responses focused on how the younger generation isn’t entering the trades but, instead pursuing higher education and college degrees. In addition, respondents indicated there is little interest to learn the trades, and that the industry work ethic, pay and training need improvement across the board. When asked why they think their company is able to retain skilled labor, 42.8 percent of superintendents responded that their company compensates well. Other responses centered on shortage of work, along with union shops with good pay and training.
Training, education and technology
When asked if superintendents feel their company provides enough training and education for their role, 56 percent stated in the affirmative, while 36.1 percent disagreed. The top three areas in which superintendents would like more education/training are: 1) scheduling, 2) Spanish on the jobsite and 3) management of subcontractors/time management. Additional comments included managing conflict and stressful situations, managing multiple projects, generation-gap mindfulness and product uses and development.
As far as technology, respondents were asked to check all that applied to them. The top three pieces of technology used in the field are the smartphone, laptop/desktop computer and tablet, followed by BIM. Other responses included drones, calculators and lasers among several others.
Social media
Pertaining to the use of social media for or related to the superintendent’s job, LinkedIn received 57.1 percent of the votes. Almost 40 percent of superintendents do not use any social media for work, and Facebook and Twitter tallied at 16.3 percent and 4.2 percent, respectively. Other forms of social media include Instagram and texting; however, additional comments indicated that social media contributes to the deterioration of building working relationships.
Younger, new-generation workforce
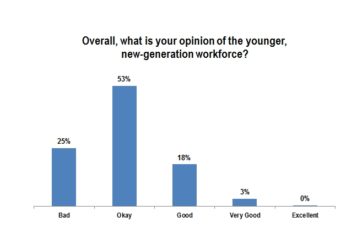
According to the majority of respondents, when asked what they think about the younger, new-generation workforce—on a scale of 1-5 with 1 being bad and 5 being excellent—the overall score totaled 2 (okay). Most of the additional comments centered on a lack of and/or poor work ethic, lack of training, laziness and a sense of entitlement. However, there were a few responses that felt the younger, new-generation workforce is full of promise.
On-time projects, delays
For the question: “What percentage of your team’s projects finish on time?” the top response at 59 percent was 80-100 percent of the time. And, if a project gets delayed, the most common causes that superintendents indicated were client changes, subcontractors completed their part(s) late and weather-related.
Jobsite product purchasing
When purchasing jobsite products (tools, safety equipment, etc.), superintendents were asked how they primarily go about buying. The top three responses were 1) through field sales rep (23.4 percent), 2) phone (22.2 percent) and 3) do not order in field/office handles (19.2 percent). The majority of additional responses were in person (local stores).
Offsite pastimes
We always enjoy learning more about our readers. For the question about what superintendents like to do outside of construction, the overwhelming response was spend time with family. Fishing and active sports ranked second and third place. Additional pastimes comprised boating, side projects, gardening and golfing. It’s obvious we have a diverse group of readers. Keep up-to-date on industry news, movers & shakers, new products on the jobsite and what’s taking place “around the world” in our new international section, and sign up to receive your free eNewsletter. Visit: www.consupt.com.
Construction Superintendent wishes to thank all respondents who took the time to make your voices heard. This survey was made possible by Asta Powerproject, a construction project scheduling solution that more than 100,000 schedulers worldwide rely on every day to create and update precise project schedules, collaborate across the enterprise, manage resources and costs and report progress to owners and clients. For more info visit: http://astapowerproject.com.
To see detailed results of the entire survey, click here.
 Join our thriving community of 70,000+ superintendents and trade professionals on LinkedIn!
 Search our job board for your next opportunity, or post an opening within your company.
 Subscribe to our monthly
Construction Superintendent eNewsletter and stay current.
Subscribe to our monthly
Construction Superintendent eNewsletter and stay current.